It’s well known that some areas of the UK are poorer than others. These include Wales and northern Britain, which used to be coal-mining areas. Now we have discovered that these regional economic inequalities are in line with regional differences in DNA as well – with people becoming increasingly clustered by certain types of genetics.
Genetic clustering has existed in all past societies. People have typically been relatively genetically similar to others nearby. But most of this was because of limited mobility. Before motorized transport, most people married and had children with someone else near to them.
Combined with the process of “genetic drift” – random fluctuations across generations that can make certain gene variants more or less common – this created broad differences across the whole genome that correlate with geography. For example, if you sample some European populations and plot the differences between genetic variations in a two-dimensional grid, you produce a rough map of Europe.
But in the 19th and 20th centuries, people started to move about more. Societies opened up geographically, and socially. This new mobility has created a new kind of clustering – what the American author Thomas Friedman called a “great sorting out.” Talented people have moved to big cities and up-and-coming areas to be with others like them.
Our paper, published in Nature Human Behavior, shows that this is now visible at the genetic level too. To show this, we looked at polygenic scores, which are predictions of a person’s traits – be it their height, personality, the chance of finishing university or whether they smoke – created purely from DNA. The scores don’t reflect the influence of a single gene, instead they add up many tiny effects from thousands or millions of genes that we already know are linked to certain traits.

For example, polygenic scores for educational attainment can predict how many years of education a person received in total. These scores aren’t completely accurate, but they have a considerable amount of predictive power. Among the 10 percent of people with the highest scores in the sample we used in our study, almost half had a university degree. Among the 10 percent with the lowest scores, less than one fifth had such a degree.
We found that those with high polygenic scores for educational attainment tend to live near others with similar scores. This clustering isn’t like the ancestral differences in DNA. It is not caused by a lack of mobility, but by mobility itself – with educated people moving to big cities and other affluent places with a competitive job market.
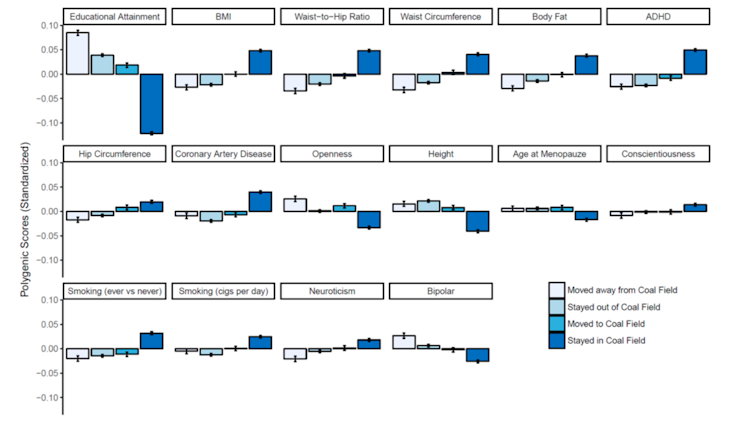
And it is increasing. During the 20th century, coal-mining areas, which had been at the heart of the industrial revolution, suffered from the decline of the coal industry. We found that people who were born in these places but later left them have a higher polygenic score for education attainment than the rest of the country, on average. And their scores are much higher than those who stayed in or moved to these areas.
Not just education
In itself, this is not so surprising. We already know that genetics accounts for some of the variations in people’s intelligence and educational levels, and common sense tells us that highly educated people would leave poorer areas for richer ones.
But across polygenic scores for many different traits, including heart disease, body mass index and smoking, we mostly saw the same pattern. Those with the more “desirable” scores on these traits – the scores that, intuitively, you would like to have – were leaving these communities. These traits included being taller, having lower BMI, not smoking, having lower rates of ADHD and being more open to experiences.
Why is this happening? Our data suggests that educational attainment is the real driver. The more genes another trait shares with educational attainment, the stronger its regional differences are for its polygenic score.
Dystopian future?
At the turn of the 20th century, European societies were very unequal. During the century, equality of opportunity and social mobility increased almost everywhere, because of modernization, democratization, and the growth of welfare states. That sounds like a good thing, and it is.
But in the 1950s, the sociologist Michael Young wrote The Rise of the Meritocracy 1870-2033. The book was a dystopian satire. In Young’s vision of 2033, the new meritocracy had become more deeply unequal than the old aristocracies. Before, the elite were on top by sheer luck, from being born into the right social caste.
But now, the elite had got there by their own efforts. They deserved to be elite, they knew it, and they passed their advantage on to their descendants. Not surprisingly, those underneath them did not see things quite the same way: a footnote tells us that the supposed author was killed in a 2034 riot.
Young may have been prescient. Rich and poor areas in Britain are not only divided by wealth, income or access to public services. The differences now extend into the very DNA of people living there. In some ways, this new inequality reaches deeper than before. As a society, we have not yet come to terms with this or thought seriously enough about how to deal with it. It’s time we start.![]()
This article is republished from The Conversation by David Hugh-Jones, Associate Professor in Economics, University of East Anglia and Abdel Abdellaoui, Post-doctoral Researcher of Genetics, University of Amsterdam under a Creative Commons license. Read the original article.
Get the TNW newsletter
Get the most important tech news in your inbox each week.


